Welcome to your GLIDR AI Dashboard. Let's take a closer look at what makes it uniquely yours.
Project Summary
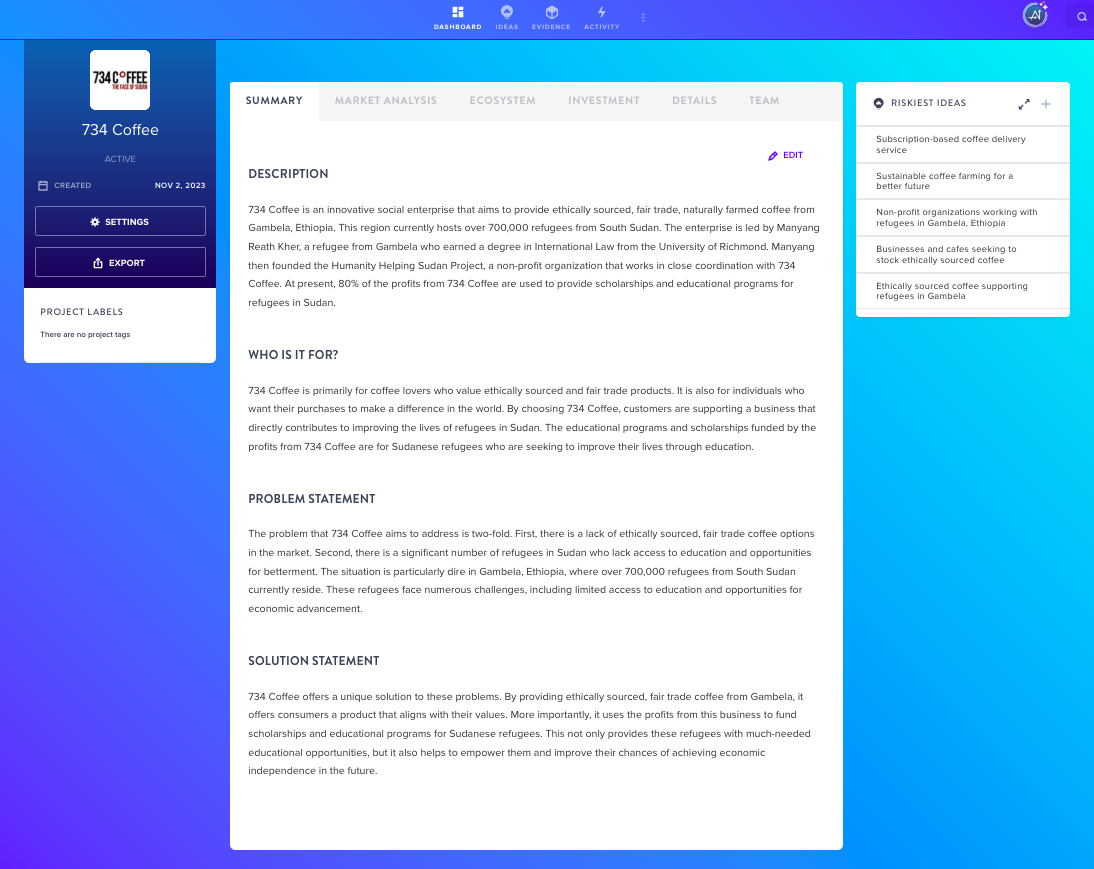
The Project Summary is where it all begins. It's crafted from your Project Description, capturing the heart of your idea, your objectives, who you're targeting, the problems you're solving, and your innovative solution.
Market Analysis
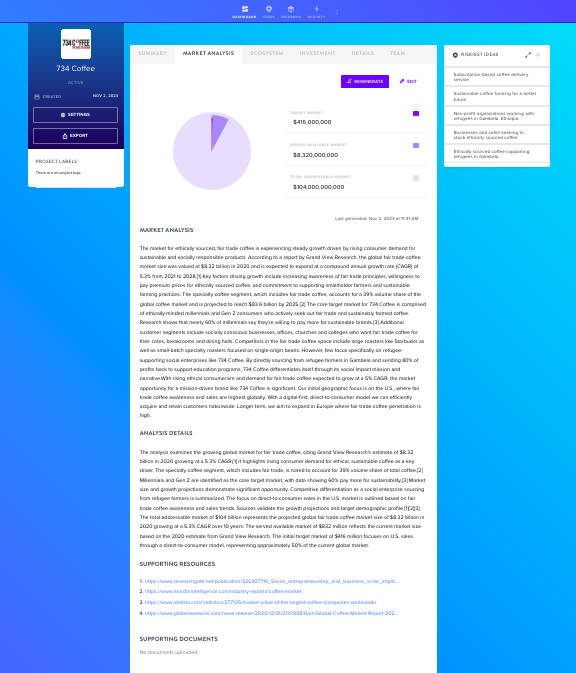
The Market Analysis is packed with data relevant to your project, such as Target Market (SOM), Served Available Market (SAM), and Total Addressable Market (TAM), as well as an in-depth Market Analysis, additional Analysis Details, and Supporting Resource links.
Note: the Market Analysis Regeneration feature is only available for Business and Enterprise tiers.
Ecosystem
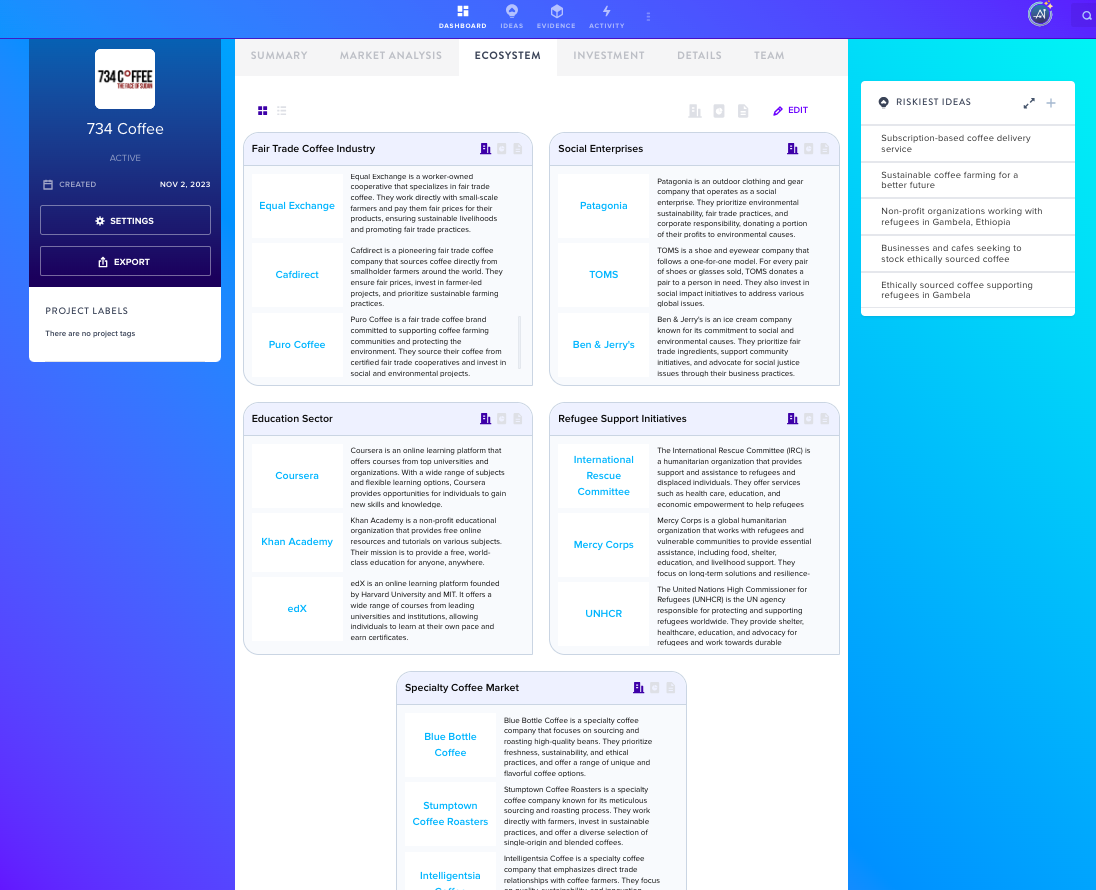
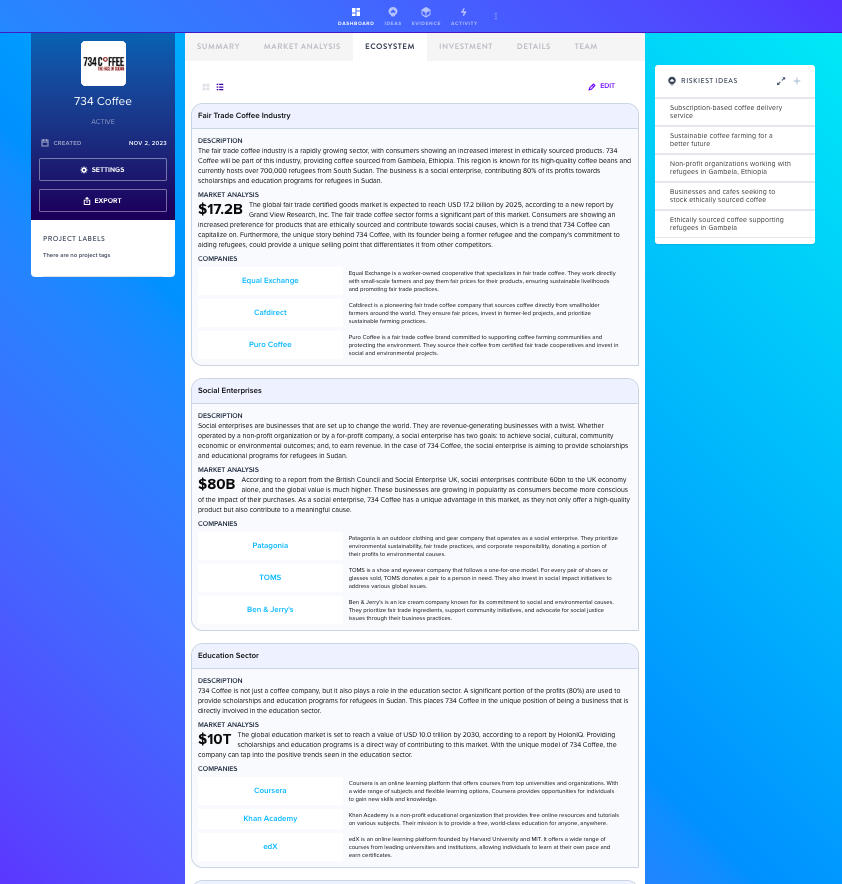
The Ecosystem offers a visual representation of your competition landscape, allowing you to see exactly where you stand in the market space, as well as potential collaborators.
Grid View:
List View:
Investment
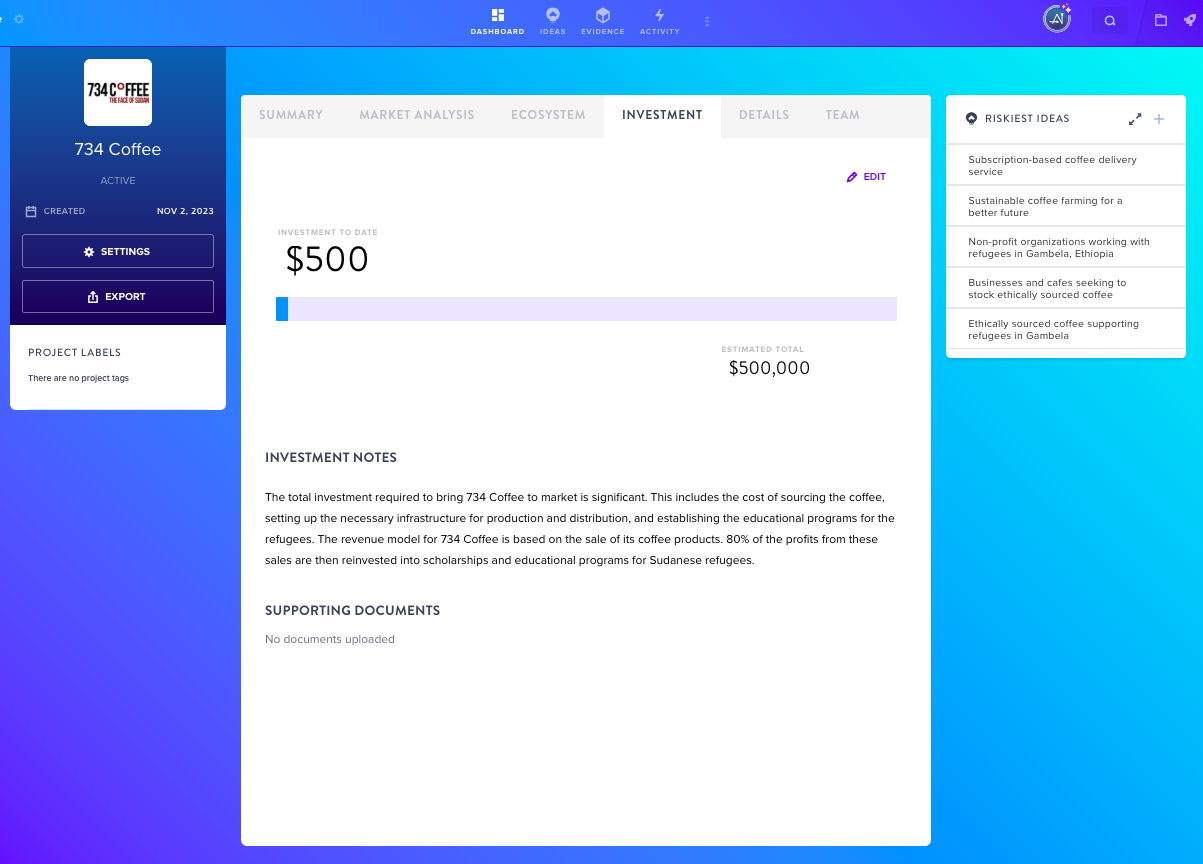
Investment is the place to view and update the total amount invested to date into your project, the estimated amount to bring to market, investment notes, and member-added supporting documents.
Details
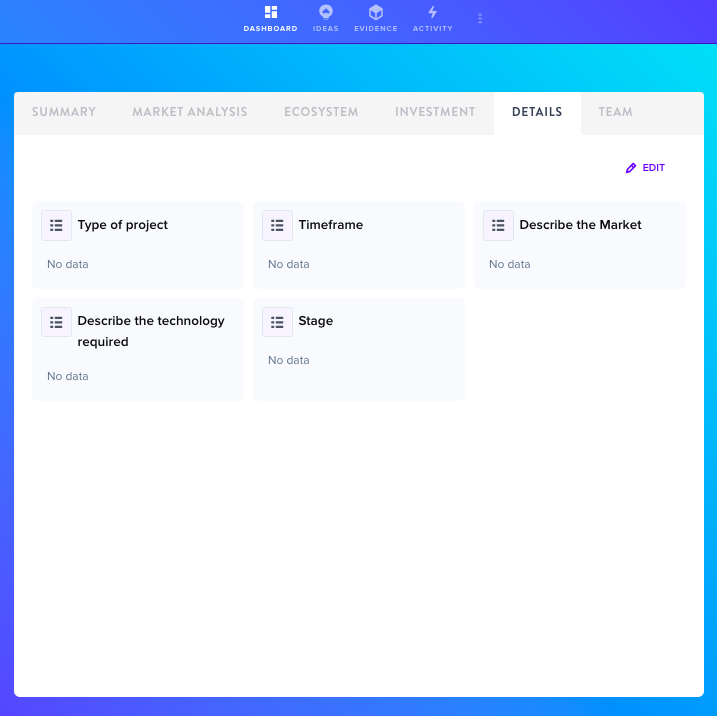
Details provides an overview for key project labels such as Technology Required, Market Type, Stage, Time Frame, and more. These labels can be edited, added, or removed.
Team
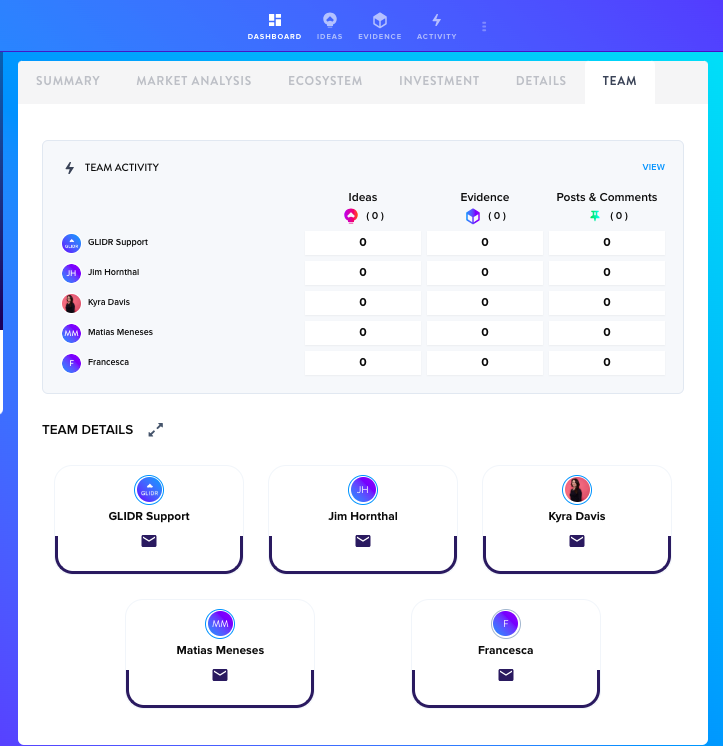
Team displays all members of the project, their individual contributions, and contact information.