
The Portfolio Dashboard supports two export formats:
- CSV — for spreadsheet analysis or piping into another tool
- PDF — for board decks, stakeholder reports, and offline review
By default, an export includes the currently displayed metric columns across all projects in your portfolio. From there you can scope it down — pick specific projects, filter to collections, restrict to a date range, and choose exactly which metrics to include.
Pick the columns to export
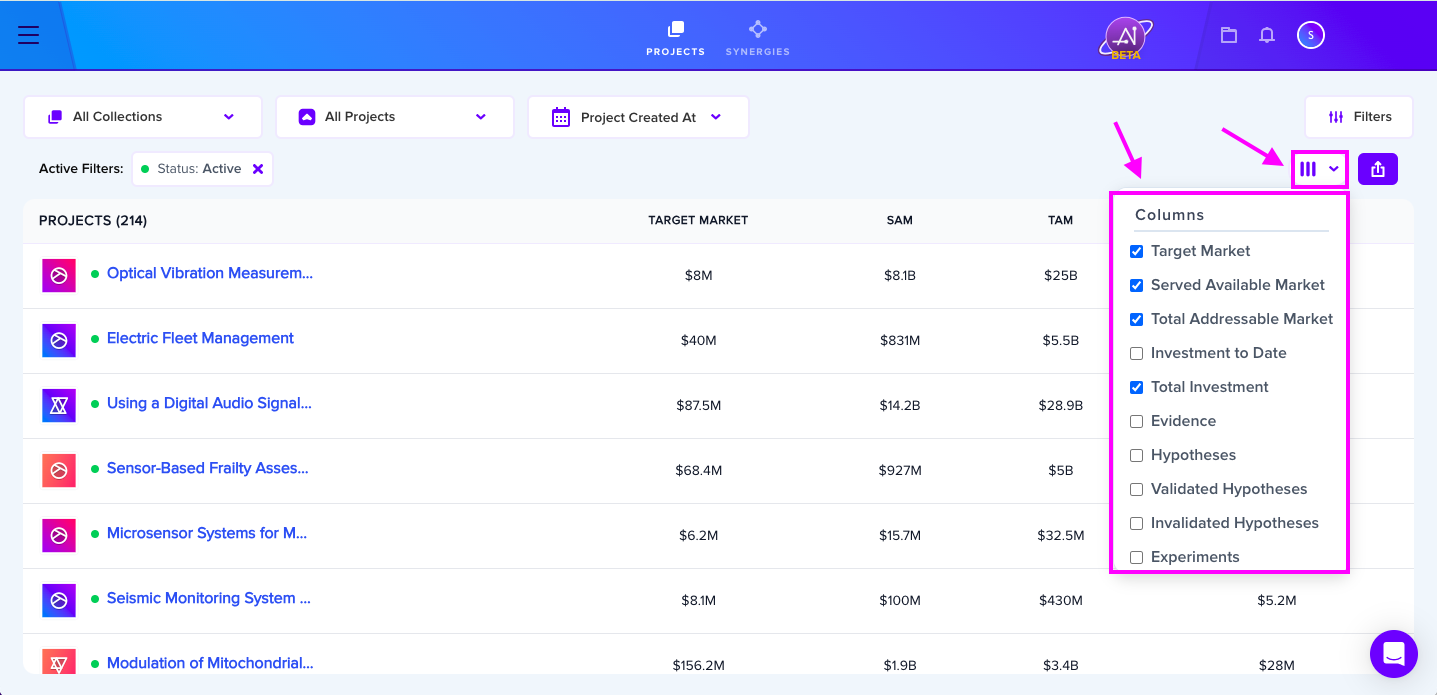
The export uses whatever metric columns are currently displayed on your Portfolio Dashboard. To change what's included, click the Columns icon and toggle metrics on or off.
Filter what's exported
Use the filters at the top of the Portfolio Dashboard before exporting to narrow down what gets pulled:
- Collections — limit to projects inside specific collections
- Projects — pick individual projects to include
- Date range — restrict to projects created within a window
Whatever the dashboard is currently showing is what the export captures.
Run the export
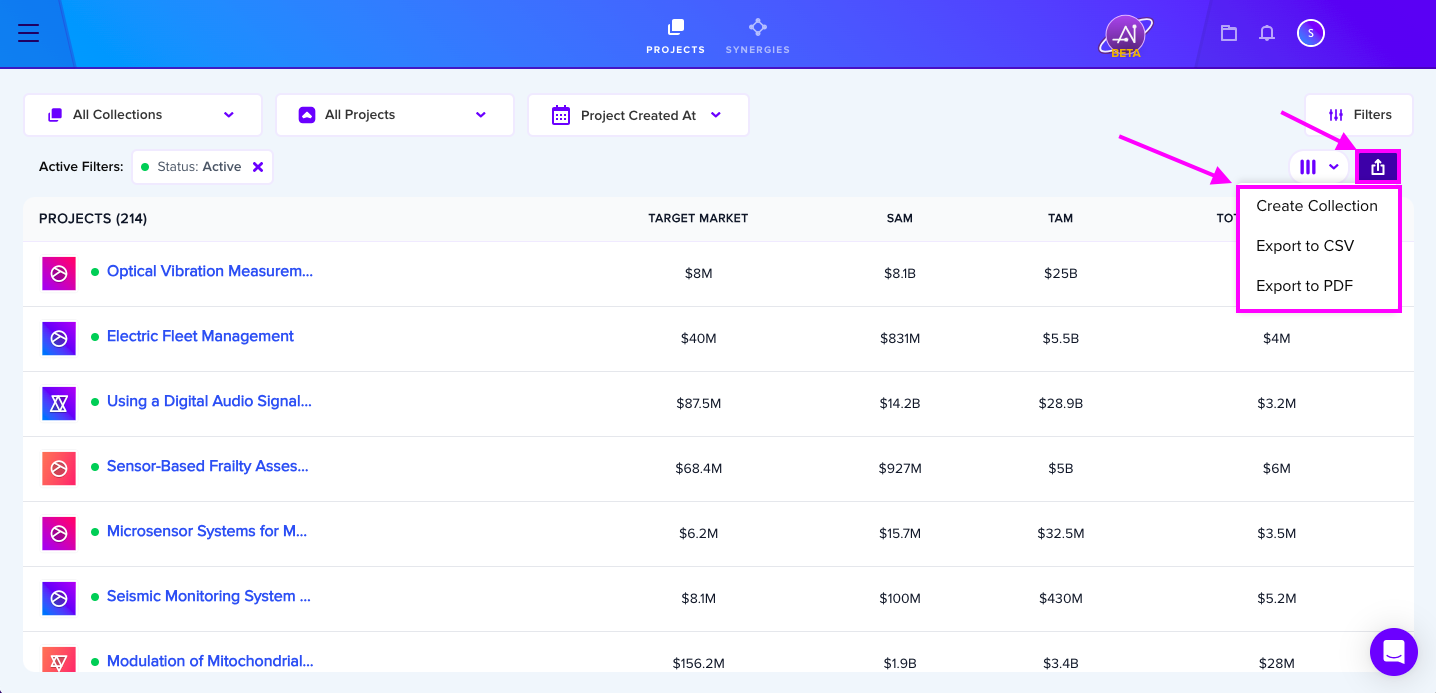
Click the Export icon and pick your format from the dropdown.
PDF export — only the top 6 metrics
PDF exports cap at the 6 most relevant metrics per export so the layout stays readable. CSV exports have no column limit. If you need every metric in one place, use CSV; if you need a polished report for stakeholders, use PDF and pick the 6 metrics that matter most for the audience.