
The Portfolio Dashboard is available to Enterprise and Business tier users and serves as a strategic tool for organizational leadership to comprehend their complete product portfolio, monitor project advancement, and synchronize investments with business growth objectives.
Accessing the Dashboard
To find the Portfolio Dashboard, click the three-line menu icon in the top-left corner and select Portfolio from the dropdown options.
Core Functionality
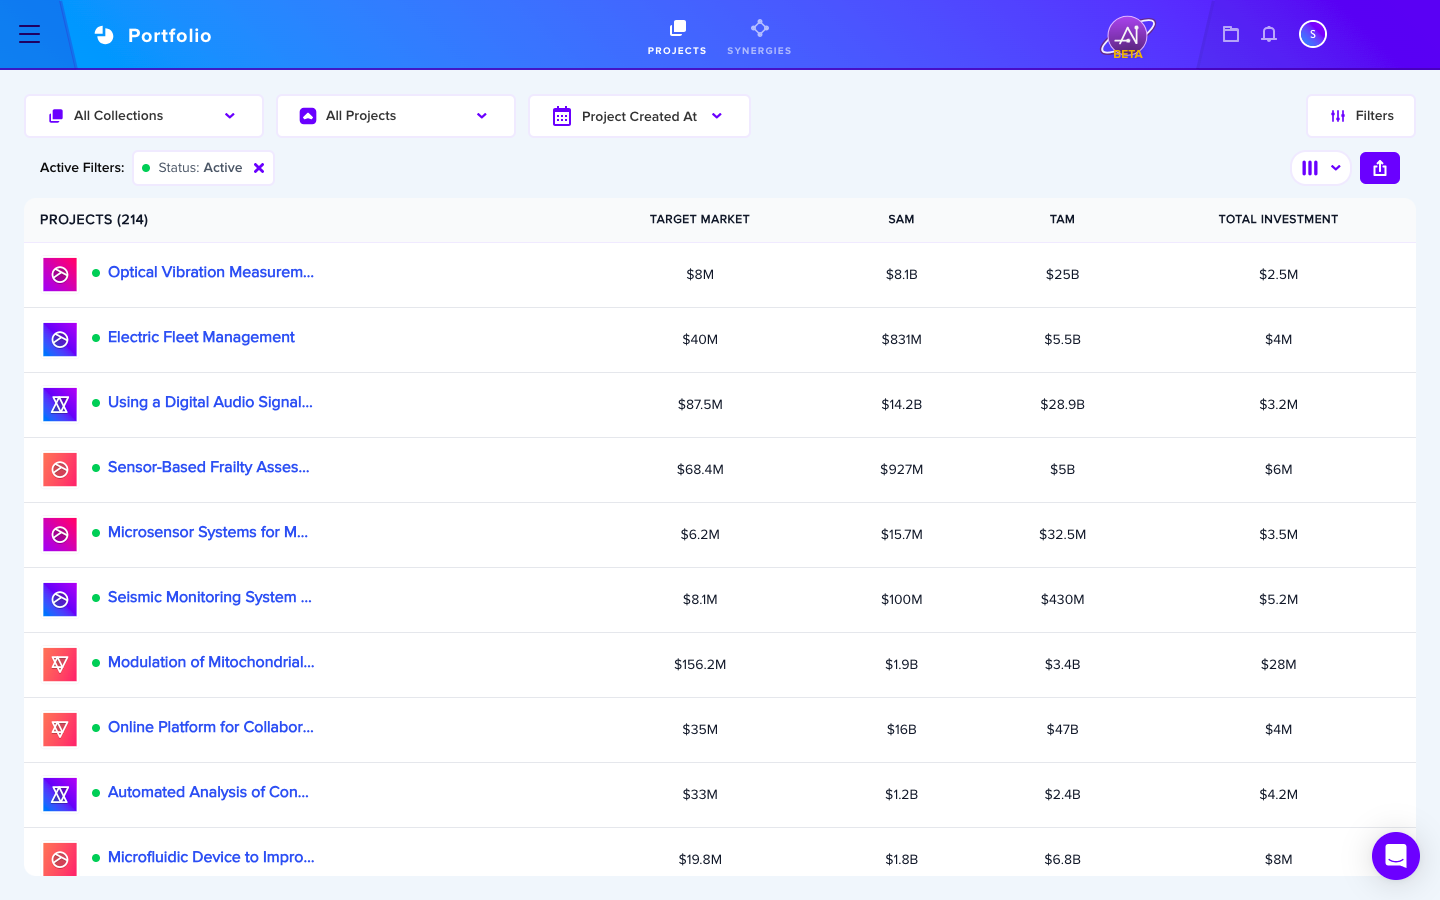
The dashboard consolidates all organizational projects — whether active, backlogged, or archived — across all development stages into one aggregated view.
Portfolio Metrics
Initial metrics displayed include Total Market, SAM, TAM, and Total Investments. Users can:
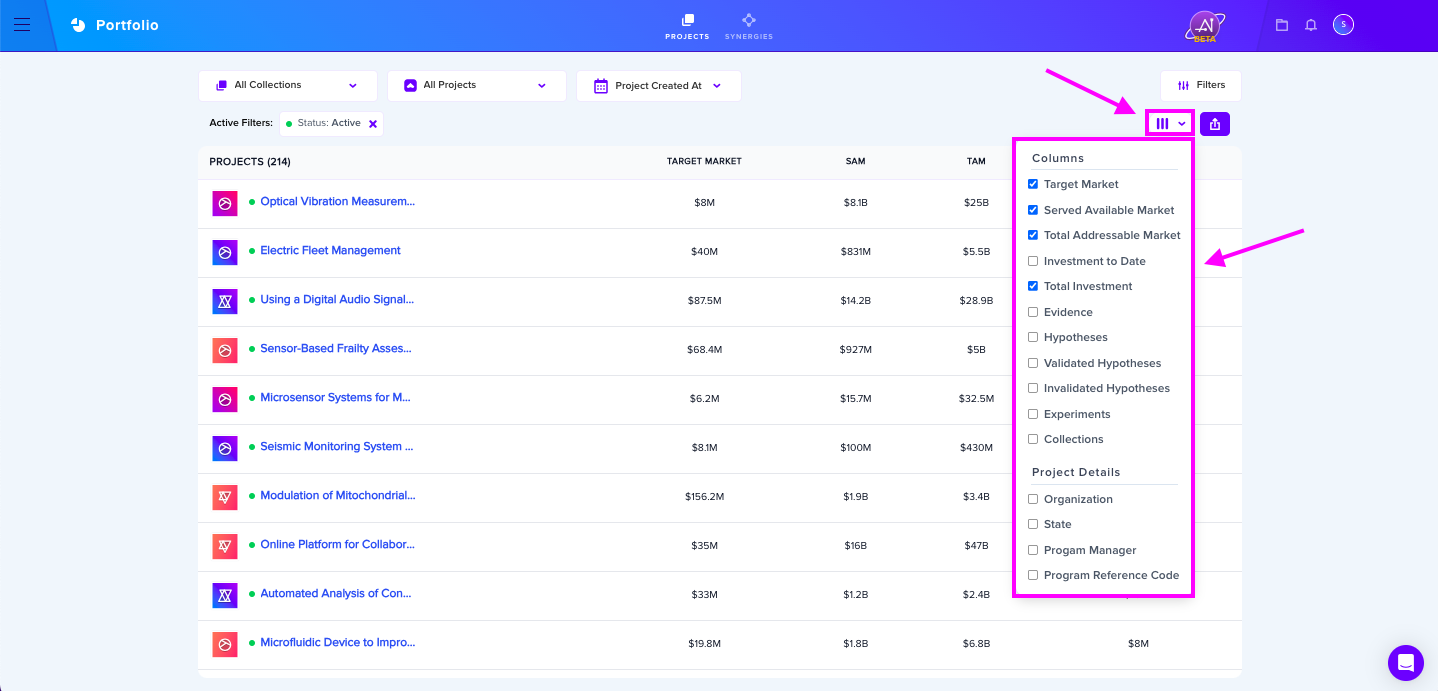
- Sort and reorganize columns by dragging column headers
- Customize visible metrics using the Columns feature to show or hide items like Investment to Date, Evidence, Hypotheses, Validated/Invalidated Hypotheses, Experiments, Collections, and Project Details
Filtering and Refining Views
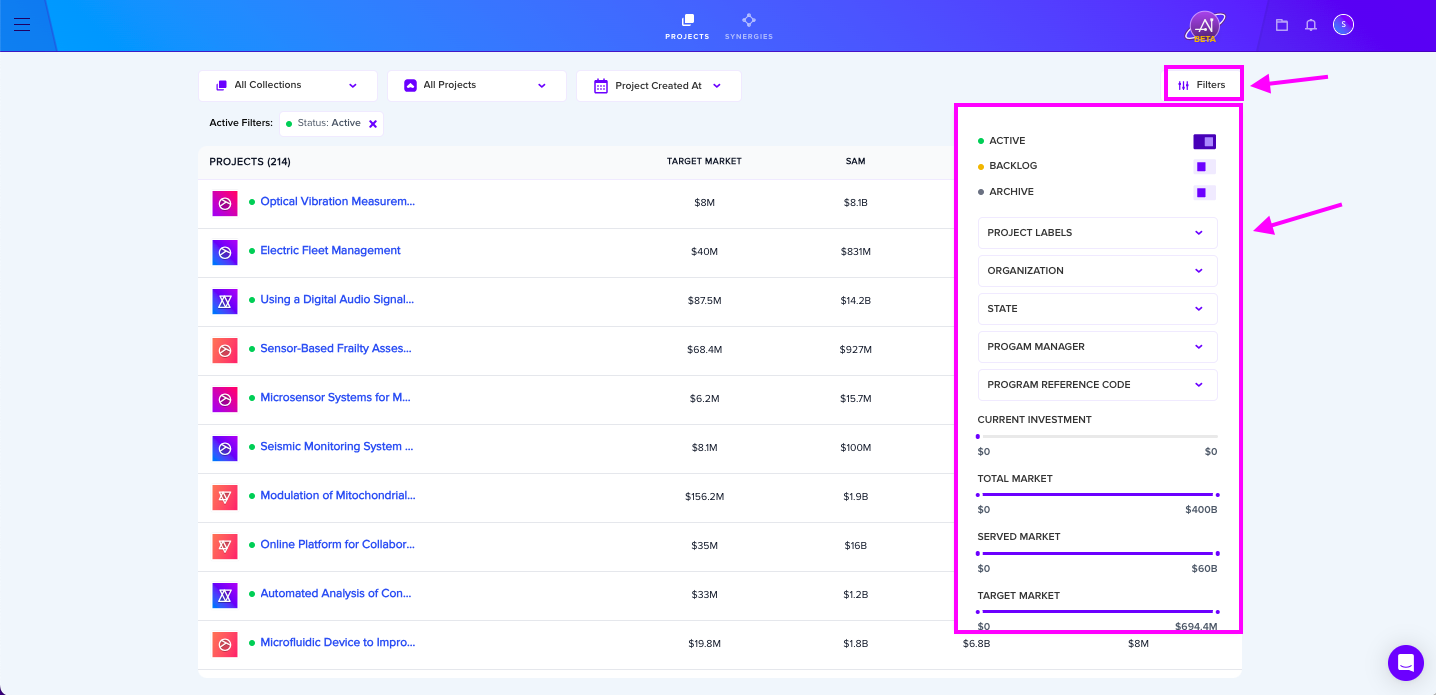
The Filters feature enables searching and displaying specific project information including:
- Project Labels
- Organization
- State
- Program Manager
- Program Reference Code
Search Capabilities
Users can evaluate collection progress, compare collections and projects, and filter by creation dates. A Reset option returns the view to all projects.
Key Benefits
- Track data quantity across projects
- Align projects and investments across strategic containers
- Measure evidence requirements and team velocity for hypothesis validation
For additional information, see articles on Portfolio Dashboard Exports and Create or Delete Collection.