
Each project created in GLIDR may correspond to a specific product, team, or company. The Project Dashboard provides a high-level overview of how the project operates, with metrics to support understanding progress.
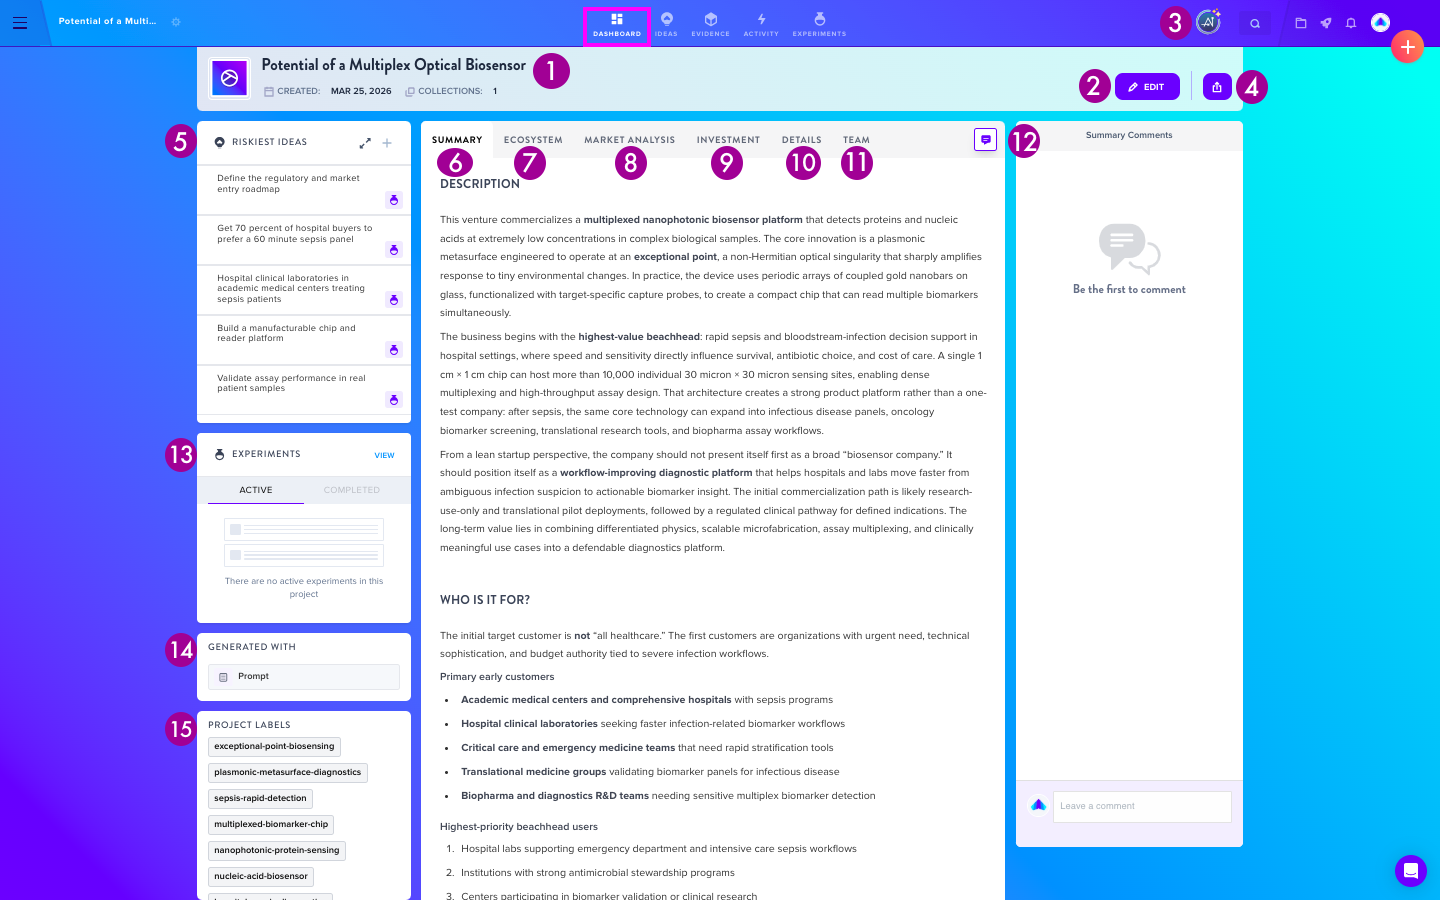
Dashboard Components
- Project Details — Summary of project name, creation date, and collection membership.
- Edit — Modify dashboard elements including project description, project labels, and tab arrangement.
- The Agent — A unique AI agent informed by the current project state that acts as a thought partner in considering possible next steps.
- Export — Download specific sections or entire dashboard data in PDF format, including Summary, Ecosystem, Market Analysis, Investment, Details, and Riskiest Ideas.
- Riskiest Ideas — Display up to 10 critical ideas currently in testing.
- Project Summary — View and edit project description, problem and solution statements, and related details.
- Ecosystem — Visual representation of competition landscape and market positioning.
- Market Analysis — Real-time market data with Target Market (SOM), Served Available Market (SAM), and Total Addressable Market (TAM) visualization.
- Investment — View and update invested amounts, estimated go-to-market costs, investment notes, and supporting documents.
- Details — Key project labels including Technology Required, Market Type, Stage, and Time Frame.
- Team — Project members and individual contributions overview.
- Comments — Collaborative discussion space with @mention capability.
- Experiments — Active and completed experiment tracking.
- Generated With — Display prompts and documents used for project generation.
- Project Labels — Overview of key project areas with manual and generated label options.